I was at LeadDev London the other week where two of my colleagues and I gave a panel talk on the subject of collaboration between engineering, product and UX. As with previous LeadDev events, it was excellent, both as a speaker and as an attendee.
After our panel I was chatting to people in the sponsor hall, and one person asked me a question which I did a terrible job at answering: what is the number one tip that you’d give to a new manager?
It’s a tricky question to answer off the cuff, because how exactly can you summarise everything you’ve learned over the last decade into just one single tip? I waffled on the answer so badly that I can’t even remember what I said. I think I blurted out about five bad tips. I had a long think about what I would have said if I had time to prepare and then I wrote this article to make up for it.
The real answer to the question is that there is no one tip. There is no secret or silver bullet to becoming a good leader.
Instead, what I would recommend is exploring a model of how you acquire new skills so you can begin developing your intuition on how to be a good leader. With time, this will allow you to do your job without needing to think so hard, freeing up your brain cycles to the things that really matter: building what your users need by running your team well.
Operating from intuition
Getting comfortable with the fact that leadership and management is driven predominantly by intuition is probably the first step towards getting good at the job.
Therefore you need to develop your intuition. But how?
There’s good news: you’ve done it before for a different skill set. In order to get a role managing programmers it’s likely that you’ve already been a good programmer yourself for some time. You’ve learned how to learn to write code.
So ask yourself: how exactly do you write good code? If you’re experienced, the answer is that you just kind of do it. It’s almost impossible to distil great creative work into a set of prescribed instructions.
The same is true with leadership, and it is also true with any non-trivial endeavour.
If you ask an expert how they do what they do, they can’t really tell you: they’ll say they just do it. And even if you copied exactly what they did to get to where they are, you wouldn’t be as good as them. Mastery in a complex domain is a unique mixture of individual talent, study, and intuition through learned experience.
So back to the question at hand: what’s my number one tip for a new manager? You need to learn how to learn, because you’re a beginner again. And you can only really train yourself through learned experience.
There’s no way to be booksmart about leadership, just in the same way that you can’t be booksmart about programming. Give me an engineer with no formal education and ten thousand hours of industry experience any day over someone who has read every single programming book but has never opened an editor in their life.
Training your model
I find it useful to think about the development of your skills as training a machine learning model that is in your brain. This model is your intuition — it’s the engine that, with time, will allow you to make good decisions and to do great work without really having to think about it. You just do it. And when you’re a skilled leader, you’ll subconsciously execute from this model pretty much all of the time.
When you’re a new leader, your model won’t have much data to go on. So you need to think about ways in which you can continually train it with more data so that it can become better at pattern matching new inputs going forward.
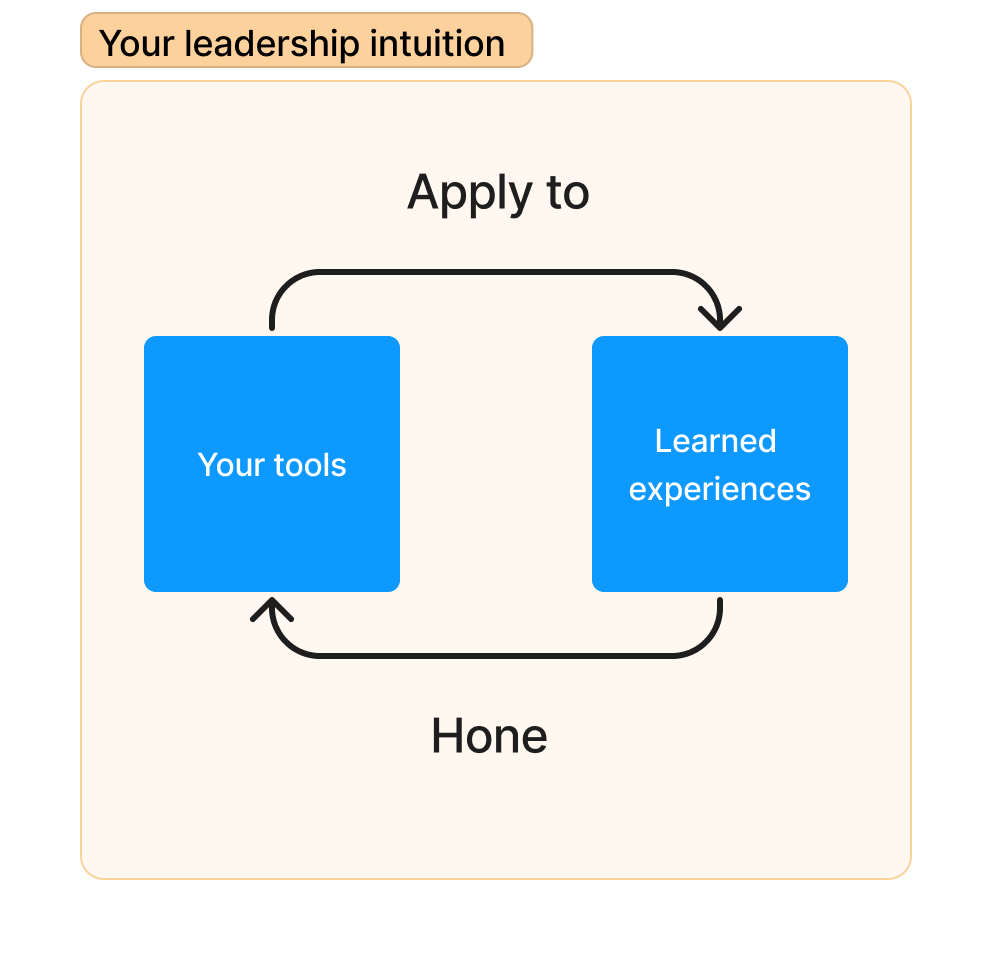
The way in which I think about this is trying to constantly expose yourself to two types of data: tools and experiences.
- Tools are skills that you can use to do your job. These are tangible things like learning or creating processes to run successful 1:1 meetings, understanding how to do basic project management and estimation, and knowing how to write and deliver a performance review.
- Experiences are the application of your tools with an observed output. Sometimes this output might be good (e.g. Alice responds really well to a particular type of feedback) and sometimes they might be bad (e.g. we all seriously underestimated that project and now we’re delivering late).
These two halves are interconnected: you need the tools to feed into the experiences, and you need the experiences to hone and improve your tools based on whether you are successful or not.
Represented as a diagram, it could look something like this:
The more tools and experiences you are exposed to, the more you’ll grow as a leader. Let’s look at each of these in turn.
Tools, not prescriptions
The first half of your model is your tools. You need lots of tools to be good at your job. You can often discover these tools by having others teach you, or by reading books and articles.
Examples of tools can be communication techniques, knowledge of how to run 1:1 meetings well, and methods to coach others and help enable them to do great work. I do love a good set of tools — it’s what both of my books are filled with.
When I wrote the books I was careful to present the contents as tools that you can experiment with yourself and see whether they work for you. This is the right way to think about building your toolbox: consider, choose, apply, learn, then keep or discard.
Unfortunately a lot of advice for new managers is far too prescription-heavy. Especially on the internet.
Consider the kinds of articles that go viral: “do this one thing to become the best leader anyone has ever seen”, “never do this or you’ll fail” or “micromanagement is bad”. Although these get your attention and your clicks, they’re a sign that they’re maybe written by someone who isn’t as good as they think they are at what they are doing, or they are just trying to drive traffic.
I’ll say it again: there is no ultimate tip, hack, right way or wrong way to be a good leader.
Everyone is a different human being, working in a different company, with different equally unique people, code, products and challenges. Assuming you’re following the golden rule, there is no right or wrong answer as to how you should be doing your job. Anyone who tells you otherwise is wrong, or perhaps they’re trying to sell you something.
Instead, try to view all of the advice and books and articles that you read as potential tools. Imagine them being a big box of spanners and screwdrivers and hammers: they might be useful, depending on what you’re trying to achieve. Sometimes they’ll work, sometimes they won’t. It’s handy to have them all around. But only you know when to pick one from the other, and even when you do, it might not be as effective as you think.
For example, searching Google for “how to do one to one meetings” yields over a million results. Which one is the best? Which is the one article that will unlock the best 1:1 meetings ever?
The answer is that there isn’t one, despite some of them claiming to be.
Approach all potential tools with an open mind and with some scepticism. Maybe pick a few of the approaches and templates and add them to your toolbox to try out. You can keep the ones that work and hone them further with experiences. You can discard the ones that don’t. You can even make your own.
Be on the hunt for tools, not prescriptions.
Experiences hone your tools
The second half of your model is experiences. If you’re working at a decent company, building interesting things, and have a team of human beings working for you, you’ll have no shortage of new experiences coming your way.
What’s important is that these new experiences let you choose a tool and measure how effective it is. You then train your intuition model by experimentation. If a tool works, then you can keep it and continue to hone your skill in applying it. If it doesn’t, then you can discard it and try a different tool for that situation next time around.
If you’re a new manager, you’ll be inundated with new experiences for the first year or so. Everything will be unseen and unfamiliar territory. You’ll have a few performance review cycles to lead your staff through, you’ll have a few projects and milestones to achieve, and it’s likely you’ll have a bunch of fires to react to and to put out.
As you step through these new experiences, you can choose different tools from your toolbox and see which ones work and which ones don’t, and the output of these experiences will train your model and make you able to do it much more easily the next time around.
If you are able to consciously observe how effective your tools are — and also get feedback from those that you work with — you’ll continue growing as a leader as you hone your tools and therefore train your model of intuition. It’s that exposure to new experiences that will make you better. There simply is no shortcut. You learn by doing. And if you learn well with the model in mind, you’ll find that more doors open for you.
And if things feel like they’re hard, then don’t worry — you’re just training your model. If things feel like they’re getting easier, it might be that your intuition is already reaching for the correctly honed tool for the experience that is being pattern matched. You can then stretch yourself by finding new experiences that aren’t yet part of your model.
So that was the real answer that I wish I could have given in person whilst standing in the LeadDev sponsor hall. Maybe next time I’ll have the right tool available as part of my model.