Last week I wrote some thoughts on managing my energy better at work, through the lens of leading and lagging indicators.
When I was writing that post—judging by the amount of times I had to check and recheck the definitions—I realised that I often get them muddled up.
So, what better way of making sure I understand something than writing about it for a large audience?
Here we go…
Q: What are leading and lagging indicators? Why are they easy to get wrong?
Whether you are building a product, running a team, or managing a company, understanding the relationship between your inputs and outputs is essential for your success.
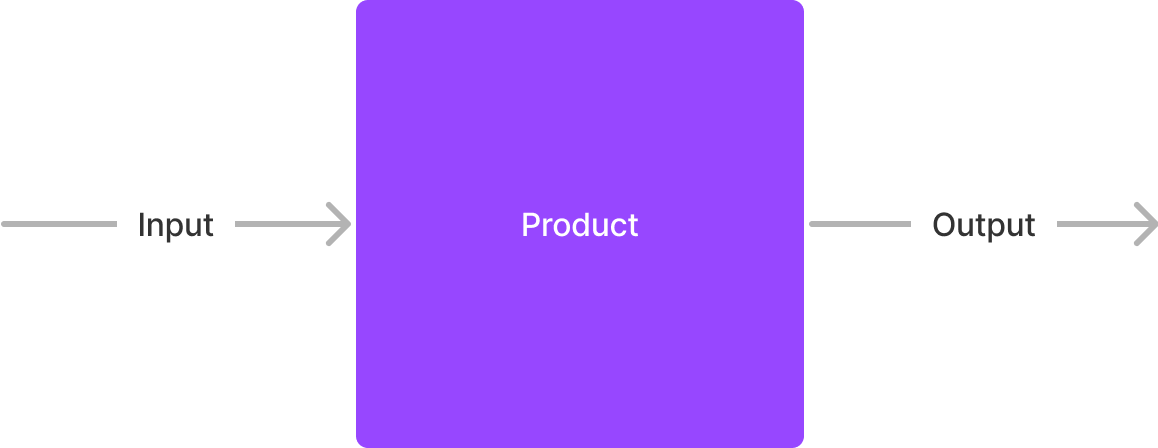
In each of those scenarios, you are creating a function that accepts inputs, transforms those inputs in some way, and then, hopefully, outputs something of greater value.
We can think about what this looks like using some boxes and arrows.
Let’s use building a product as an example. Any product that you build is going to have inputs and outputs.
Product inputs fall into categories such as:
- Installs, such as the number of downloads, or purchases from a physical store.
- Usage metrics, such as the number of daily, weekly and monthly active users.
- Engagement metrics, such as the number of successful actions that have been performed in the product (e.g. ads created, workflows completed, amount of newsfeed items read, or number of tickets booked) or the amount of time spent in each user session.
These are all of the numbers that are feeding into the box.
Then there are the outputs, which are important things like:
- Stickiness, which is typically measured as a ratio of daily active users to monthly active users, giving you an idea of how often users are regularly coming back.
- Retention, which is a longer term measurement of whether your users are continually active over meaningful periods, such as yearly renewal cycles or monthly billing periods.
- Revenue, which is, well, revenue. It’s the amount of money that you are making—probably the most important metric of them all for any commercial product.
These inputs and outputs are what we call leading and lagging indicators. The inputs are leading indicators, and the outputs are lagging indicators.
Leading indicators
A leading indicator is a metric that allows us to better understand how something is going to perform in the future.
In our product example above, the leading indicators are the inputs into our box.
We could reason that the number of installations that we are seeing of our product from week to week is one reasonable predictor of how it is going to perform in the future. After all, if nobody is installing it, we’re not going to make any revenue. The more people that install it, the greater the chance that we have of our revenue going up.
As per the examples in the previous section, there are often multiple leading indicators at play in any system. Exactly which ones you should pay attention to is something that can only be decided by you in the context of the system that you’re measuring.
The great part about leading indicators are that they are:
- Quickly measurable, often in short feedback loops. For example, you can measure leading indicators daily or weekly in order to get an up to date view on your system.
- Able to be affected by you, often in a short space of time. If your leading indicators are starting to drift outside of bounds that you deem acceptable, then you can make immediate changes to address that drift (e.g. make changes to the sign-up page).
Let’s take this example beyond a software product.
Imagine that you were thinking about leading indicators for the performance of the engineering team which you are managing.
One leading indicator could be the amount of critical production bugs that you are facing. This is because every time there is a critical bug, your team has to get interrupted away from what they are doing in order to triage and fix that bug, which in turn reduces their ability to get their current work done. I’m sure you can think of others.
Now, to another example. Imagine that you are gradually renovating an old house.
You know that the energy efficiency of the house is poor (imagine that it is in the UK and has an energy rating of G—the worst!) so you look at a leading indicator which is the amount of windows that are in good repair and double glazed.
That metric currently stands at 20%, so you decide that you are going to invest in replacing the windows over the next few years. The number of high quality insulated windows are your leading indicators of your energy rating.
Lagging indicators
A lagging indicator is a metric that allows us to better understand how something has happened in the past.
Looking back at our previous examples, we identified that:
- Revenue was a lagging indicator for a product. If it has been doing well, then it will hopefully be making money.
- An engineering team’s lagging indicator could be shipping their milestones on time. This is because they’re happy, empowered and not getting interrupted by production issues.
- A house’s energy efficiency lagging indicator may be an energy rating of A because it is well insulated and has no current structural issues that need fixing.
The tricky part about these lagging indicators is the inverse of the great part about leading indicators:
- They require measurement over long periods of time to fully understand. For example, you might not know if your team is going to ship the new operating system on time until it has been finished in 3 years time.
- You can’t directly affect them, since they’re an aggregated effect of leading indicators. If you make changes now, you might not see an impact in your lagging indicator for months or even years (e.g. think of annual billing cycles for software and your users churning at the end of the period).
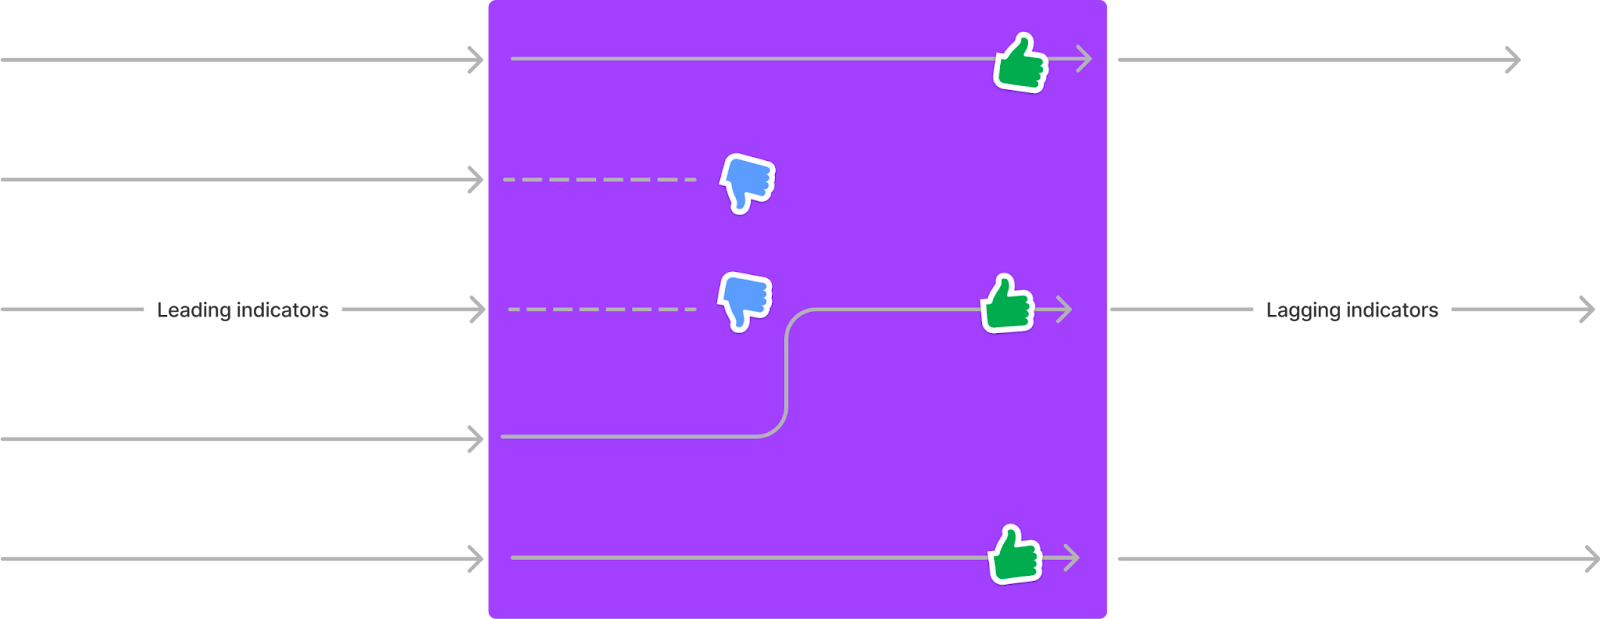
So the art of bringing it all together is that you need to ensure that the leading indicators that you are affecting are proven to be responsible for the lagging indicators.
Bringing it all together
For many situations, this involves a combination of intuition, research and trial and error.
You need to work out which of the leading indicators have an effect, and those that are red herrings.
Back to our box diagram:
There can be a lot to learn from prior art.
For example, if you’re building a B2C SaaS product, there are lots of resources that can give you a head start in defining your leading and lagging indicators. Sequoia Capital has a detailed article on measuring product health which I also consulted while writing this article.
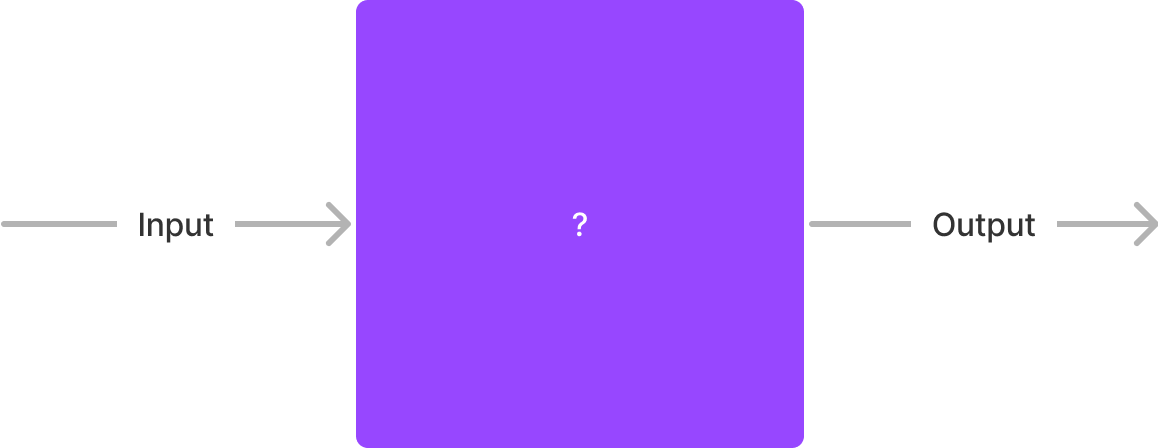
However, defining leading and lagging indicators gets more challenging when you are either measuring something that hasn’t been measured before (e.g. you are building a product in a completely new category) or you are dealing with a system that is hard to measure in the first place (e.g. what actually is the output of a good engineering team?)
This isn’t all bad, though.
Leading and lagging indicators can be the foundations of some valuable discussions within your team. For example:
- What does it actually mean to perform well and to have great outputs?
- How can those be measured as lagging indicators, if at all?
- What are the leading indicators that contribute to those lagging indicators, and how can you be aware of them on a daily, weekly and monthly basis?
Why not go and chat to your team and find out?
Oh, and while you’re at it, why not try and apply leading and lagging indicators to other parts of your life?
- What are the leading and lagging indicators of healthy personal and family finance?
- What about your diet and your health?
- What do leading and lagging indicators mean for the health of a community or city?
Leading and lagging indicators are a great model to think about how systems work in general, at all scales, shapes and sizes. All it takes is a box.
Extra bits
Before I go, I have a few extra bits to share.
I had an excellent article recommended to me by a reader after last week’s post about managing energy levels and burnout.
It’s called “How to know when to stop” and it’s written by Andy Johns. It has some great models that cover our ranges of tolerance, career progression and life progression. It’s well worth your time.
If you’re interested in what the remote onboarding process is like at Shopify, then I published an article over on the Lead Dev blog that highlights my experiences of joining the team last year. Our onboarding program is fantastic. I outline what happens in the first few weeks in a way that will allow you to replicate the success at your own company.
And lastly, I’m really excited to be hosting and curating one of the tracks at QCon San Francisco —and virtually at QCon Plus—later this year.
We’re going to be exploring the new world of hybrid work with a fantastic line-up of speakers:
- Brian Elliott, SVP at Slack, leader of the Future Forum and author of How the Future Works
- Lena Reinhard, founder, coach and consultant at Lena Reinhard Leadership Coaching and Consulting, previously VP Engineering at Circle CI and Travis CI.
- Alexandra Sunderland, Senior Engineering Manager at Fellow and author of Remote Engineering Management.
- Jesse McGinnis, Senior Dev Manager at Shopify.
If you’re interested in signing up, then you can get a $75 discount by using the code JamesSQSFPLUS2275 (yes, that’s quite a long code).
The first 5 people to register with the code can get a free copy of my book, Effective Remote Work. Neat!